


Science-based set of indicators and methodology
The indicators as well as the methodology have been developed over several years by experts of FiBL and are regularly adapted to the latest scientific knowledge. To achieve the best possible acceptance, legitimacy and compatibility further reference documents have been considered during the development, such as the sustainability reporting guidelines of the Global Reporting Initiative GRI-G4, the UN Global Compact, the ISO 26000 "Guidance for social responsibility", the SA8000 standard for social responsibility, the ILO work and social standards as well as the indicator matrix of the Economy for the Common Good.
The assessment method involves, among other things, a weighting of the indicators according to the level of impact on the various SAFA subthemes. Furthermore, the sphere of influence and responsibility of the respective farm or company as well as the time, place and responsible party of sustainability impacts within the supply chain are being considered.
Sphere of influence – Assessment of the entire supply chain
For an assessment, not only the procedures on the farm or company premises are being considered, but also the entire sphere of influence and responsibility of the respective farm or company within the supply chain. The sphere of influence usually depends on the respective position of the farm or company within the supply chain, its size and market power and will normally be identified before or at the beginning of a SMART assessment.
It may include upstream processes, through to primary producers, as well as downstream processes through to the consumer. With regards to products, the complete lifecycle from the production of raw materials up to their disposal is taken into account.
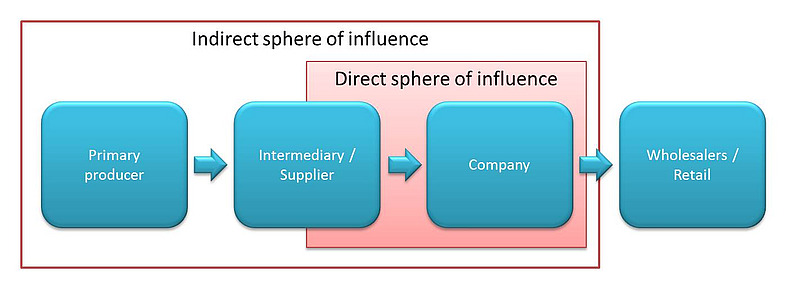
A distinction is made between the direct and indirect sphere of influence. The direct sphere of influence includes all processes that take place on the farms or company`s premises as well as all processes that take place at suppliers or buyers on which a direct influence exists, e.g. in the form of close business relations or even mutual dependence. The indirect sphere of influence includes all areas in which actions of the assessed entity only have an indirect impact, as for example, when buying agricultural raw material from intermediaries.
The consideration of the indirect sphere of influence is crucial, since the most important environmental and social impacts of operations often occur in preliminary stages of the supply chain. In the figure above, an example of the sphere of influence of a food processing company (company) is shown.
Materiality analysis – relevance check
Prior to a SMART assessment the relevance of themes and subthemes of the SAFA Guidelines for each company or farm will be analysed. Accordingly, context-specific indicators are compiled individually for each farm or company. In case one or several themes are deemed irrelevant for the assessment, they will not be rated. However, for reasons of transparency, exclusions have to be explained in detail. This procedure is not only in line with the SAFA Guidelines, but also to other standards as for example the GRI-G4.
Use of existing data – compliance check
Often a wide range of data in a written form already exists within companies or farms. This data will be obtained and used in the assessment. Data from certifications, audits, CO2-Calculations or from LCA or CO2 assessments are seamlessly integrated into the SMART assessment, which greatly reduces the time needed.
Transparent and comparable assessments
Following a defined assessment method based on an individually selected set of indicators it is measured to what extent the farm or company has met the sustainability objectives for each of the 58 themes defined in the SAFA Guidelines. As shown in the figure below, the achievements of the objectives are assessed using a five level scale from 0 or red (unacceptable) to 4 or dark green (best, objective fully achieved). This scale is also used for the display of the assessment in radar charts, showing the results as percentage figures.
SMART - Sustainability analysis, Farm Peter Miller (Example report)